Market Statistics

Found 20 blog entries about Market Statistics.

I just added the latest local market statistics to my Facebook Fanpage.

Find my review of 2010 HERE

It is part of my Fans-Only page, so be sure to "like" the page to see the content.

My report includes a month-to-month look at the total number of homes sold as well as active homes on market. You can also see a breakdown of new listings per month, new under contracts for each month, and total number of homes under contract for the month.

There is a link to recent articles on foreclosures and reports on the current market value.

You can also see information on remaining grant money, interest rates, and my interpretation of current trends.

Become a fan, and gain access to valuable market information!

1,388 Views, 0 Comments

Where to Sell a Home in Utah this October!

You've heard that it's a buyer's market. This can be an advantage if you are selling your home. If you live in one of these Hot Spots, demand is higher in your area. You’ll be able to sell your home for top dollar. Then you can take advantage of the great deals available elsewhere as a buyer. The lower interest rates give you more buying power. If you live in a hot spot, now is the time to list your home.

Utah’s Hot Spots are the zip codes and prices ranges that had the most demand last month. Economic improvement and recovery start in hot spots and then spread to other areas of the valley. Purchasing a home in one of these hot spots gives you a front row seat to economic recovery.

1. Riverton, Zip 84065

1,279 Views, 0 Comments

Here's a quick video for my Listings.

For more information and graphs check out my earlier report comparing the home sales along the Wasatch Front, with those of the rest of the nation.

As well as my reaction to the July statistics: Double Dip?

1,348 Views, 0 Comments

How did home sales across the Wasatch Front match up with the rest of the nation?

This is a graph of how many homes sold across the Wasatch Front. The Green line represents the sales this year. The orange line is 2009 and the blue line is 2008.

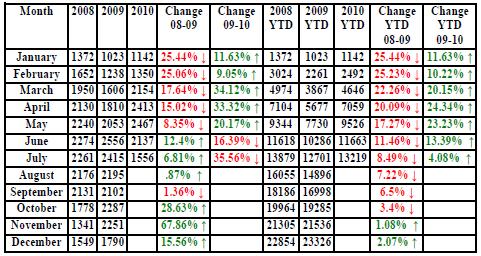
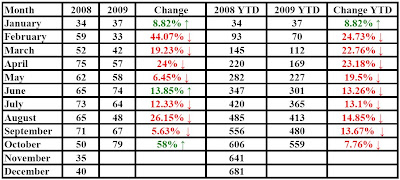
  Here are the actual numbers:   
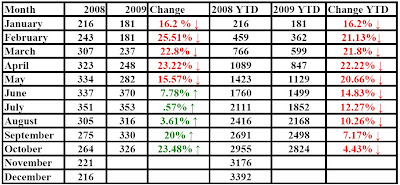
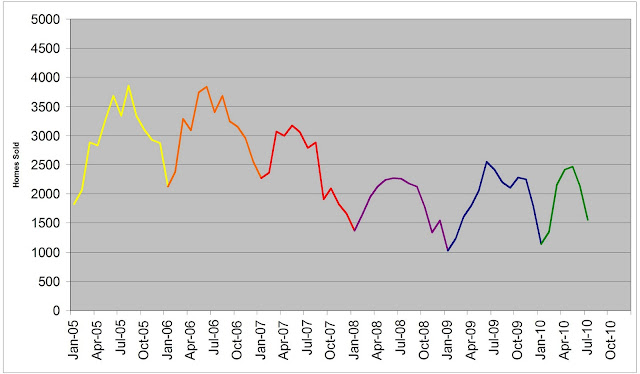
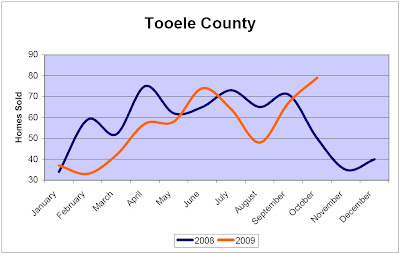
Here are what homes sales have looked like across the Wasatch Front since 2005:   And here is how many homes sold across the nation for the past 5 years:  
1,906 Views, 0 Comments

The National numbers are in and it looks like we have a double dip situation on our hands. January 2009 was the bottom of the market, but last months numbers show we could have another dip approaching. Last month the United States' home sales fell to a level we haven't seen in almost 15 years! Everyone expected home sales to be a little lower, but the results were lower than anyone thought. We knew it would be low because of the expiration of the tax credit. The tax credit compressed months of demand into a short period ot time. When you look at home sales there is a spike corrolating with BOTH tax-credit deadlines.   
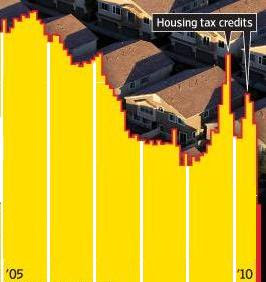
Now that the tax credit is gone we are experiencing a decrease in demand. Because less homes are selling there are more homes…
1,468 Views, 0 Comments

Top Places to Buy/Sell a Home in Utah this March!

The economic growth and progress of 2010 is continuing to increase! This continuing trend of growth is showing a heightened interest in the housing market. The deadline for the free grant money is approaching quickly! Those interested in buying a home this year need to act fast. This increase in demand is pushing the success of the market through the winter months.

Knowing when to sell or purchase a home is vital to Real Estate success and the demand is highest in Utah’s Hot Spots! These locations are the zip codes and prices ranges that had the most demand and highest success last month. Economic improvement and recovery start in hot spots and then spread to other areas of the valley. These hot

1,219 Views, 0 Comments

Top Places to Buy/Sell a Home in Utah this February

2010 is off to a great start! This January had a higher number of homes sold than the beginning of last year. This continuing trend of growth is demonstrating an increased interest in the housing market. Knowing when to sell or purchase a home is vital to Real Estate success and the demand is highest in Utah's Hot Spots! These are the zip codes and price ranges which have had the most demand and highest success rates last month. Economic improvement begins in Hot Spots and spreads to other areas of the valley. These Hot Spots are the areas that will get top dollar for their home. Purchasing a home in one of these Hot Spots gives you a front row seat to economic recovery.

1. Salt Lake City Zip 84108

1,263 Views, 0 Comments

The last quarter of 2009 showed growth in the number of homes sold. This increase in sales pushed the total number of homes sold in 2009 higher than 2008! This trend of growth is showing an increasing demand in purchasing a home. Knowing when to sell or purchase a home is vital to your Real Estate success, and the demand is highest in Utah’s Hot Spots!

These Hot Spots are the zip codes and prices ranges where there has been the highest demand for homes. Economic improvement and recovery start in hot spots and then spread to other areas of the valley. These hot spots are the areas that will get top dollar for their home. Purchasing a home in one of these hot spots gives you a front row seat to economic recovery.

1. Bountiful: Zip 84010 &nbsp &nbsp

1,024 Views, 0 Comments

How well did the housing market do last month? I think these figures speak for themselves:


Compared to last October, Salt Lake County had over 23% more homes sell.

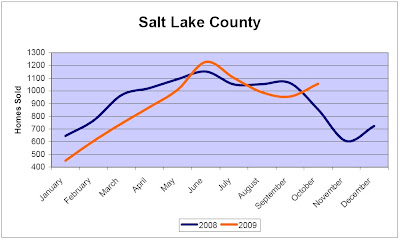
  Ever Since May, Utah County has had more homes sell this year than last year. In fact only three months in 2009 have had less homes sell than 2008!


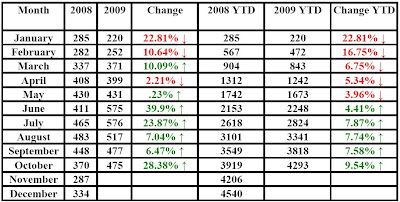
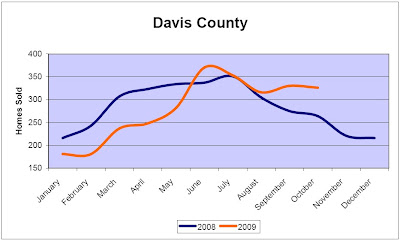
Davis County also had a 23% increase in home sales from last October.


Unbelievable! Tooele County had 58% more homes sold in October 2009 than October 2008!


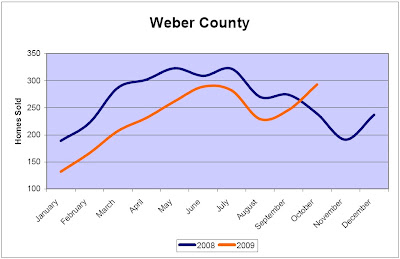
For the 1st time this year Weber County has had more homes sell than a year ago. October had a 22% increase in home sales over last year!
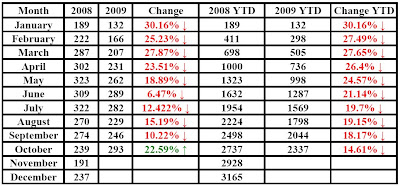
  Here is the total number of homes sold in the preceding counties!
1,606 Views, 0 Comments

Current Situation…and the CRYSTAL BALL for the future

A week ago we were talking in our office about demand. We have been watching ‘pending’ home sales decline and decline. This is typical during this time of year. Generally 1rst quarter after 4th quarter is where it bottoms out. So we thought, when was the last time home sales have been this low? We can’t find data that goes back that far. We speculated it must be as far back as the 1980′s. It also seems like the demand should be there to buy homes, but where are the buyers? We speculated as well that the demand is there and that it would arise soon. Im not an economist (Im a salesperson, I sell real estate not analyze numbers, we are diffrent breeds) and I dont have the data they do, so I looked

1,202 Views, 0 Comments