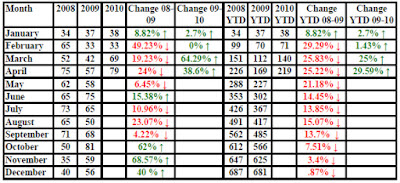
Viewing statistics is vital to predicting Real Estate trends. I keep track of how many homes are being sold across the Wasatch Front to stay informed for my friends and clients. There are many other factors affecting the Real Estate industry, but this is a quick way to glimpse market changes. Homes prices are driven by how many homes are being sold. When there is a considerable increase in demand prices and values go up.
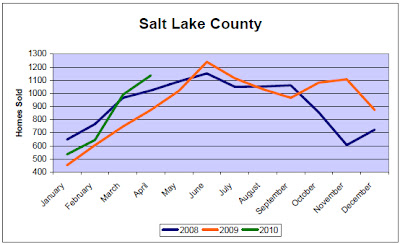
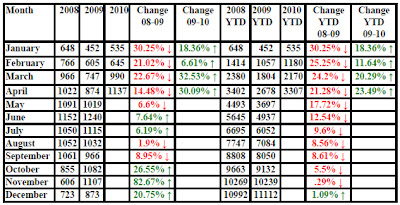
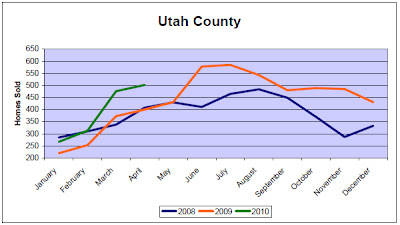
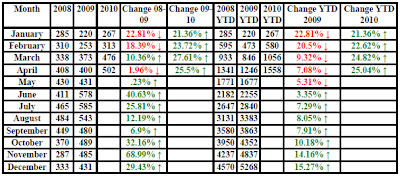
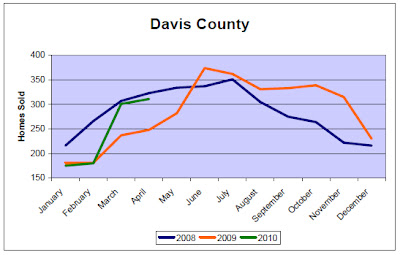
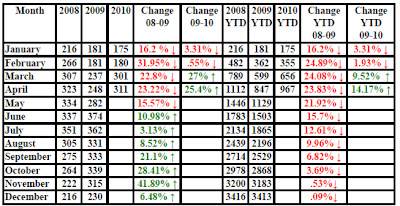
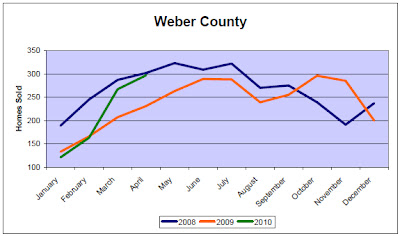
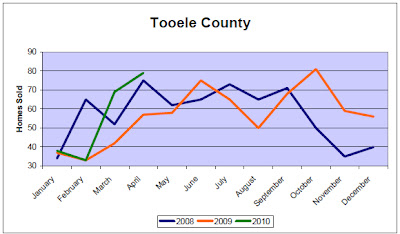
These graphs and statistics show how many homes have been sold each month for the past 3 years. You can clearly see the bottom of the market back in January of 2009. So far we have had over 20% more homes sell this year than at this point last year. For more information about what these statistics mean for your particular situation e-mail me. There are some great opportunities available for this summer!
What is the chance of selling your home in today's market? Check out my Crystal Ball to find out.
You can also get a free market snapshot sent directly to your e-mail. Call 801-966-4000 and ask how you can get your FREE MARKET SNAPSHOT!
| Total Homes Sold in Salt Lake, Utah, Davis, Weber, and Tooele Counties. |



Leave A Comment